
What are the most valuable methods in AI?
Steve Sperandeo ·
Watch the three-minute film
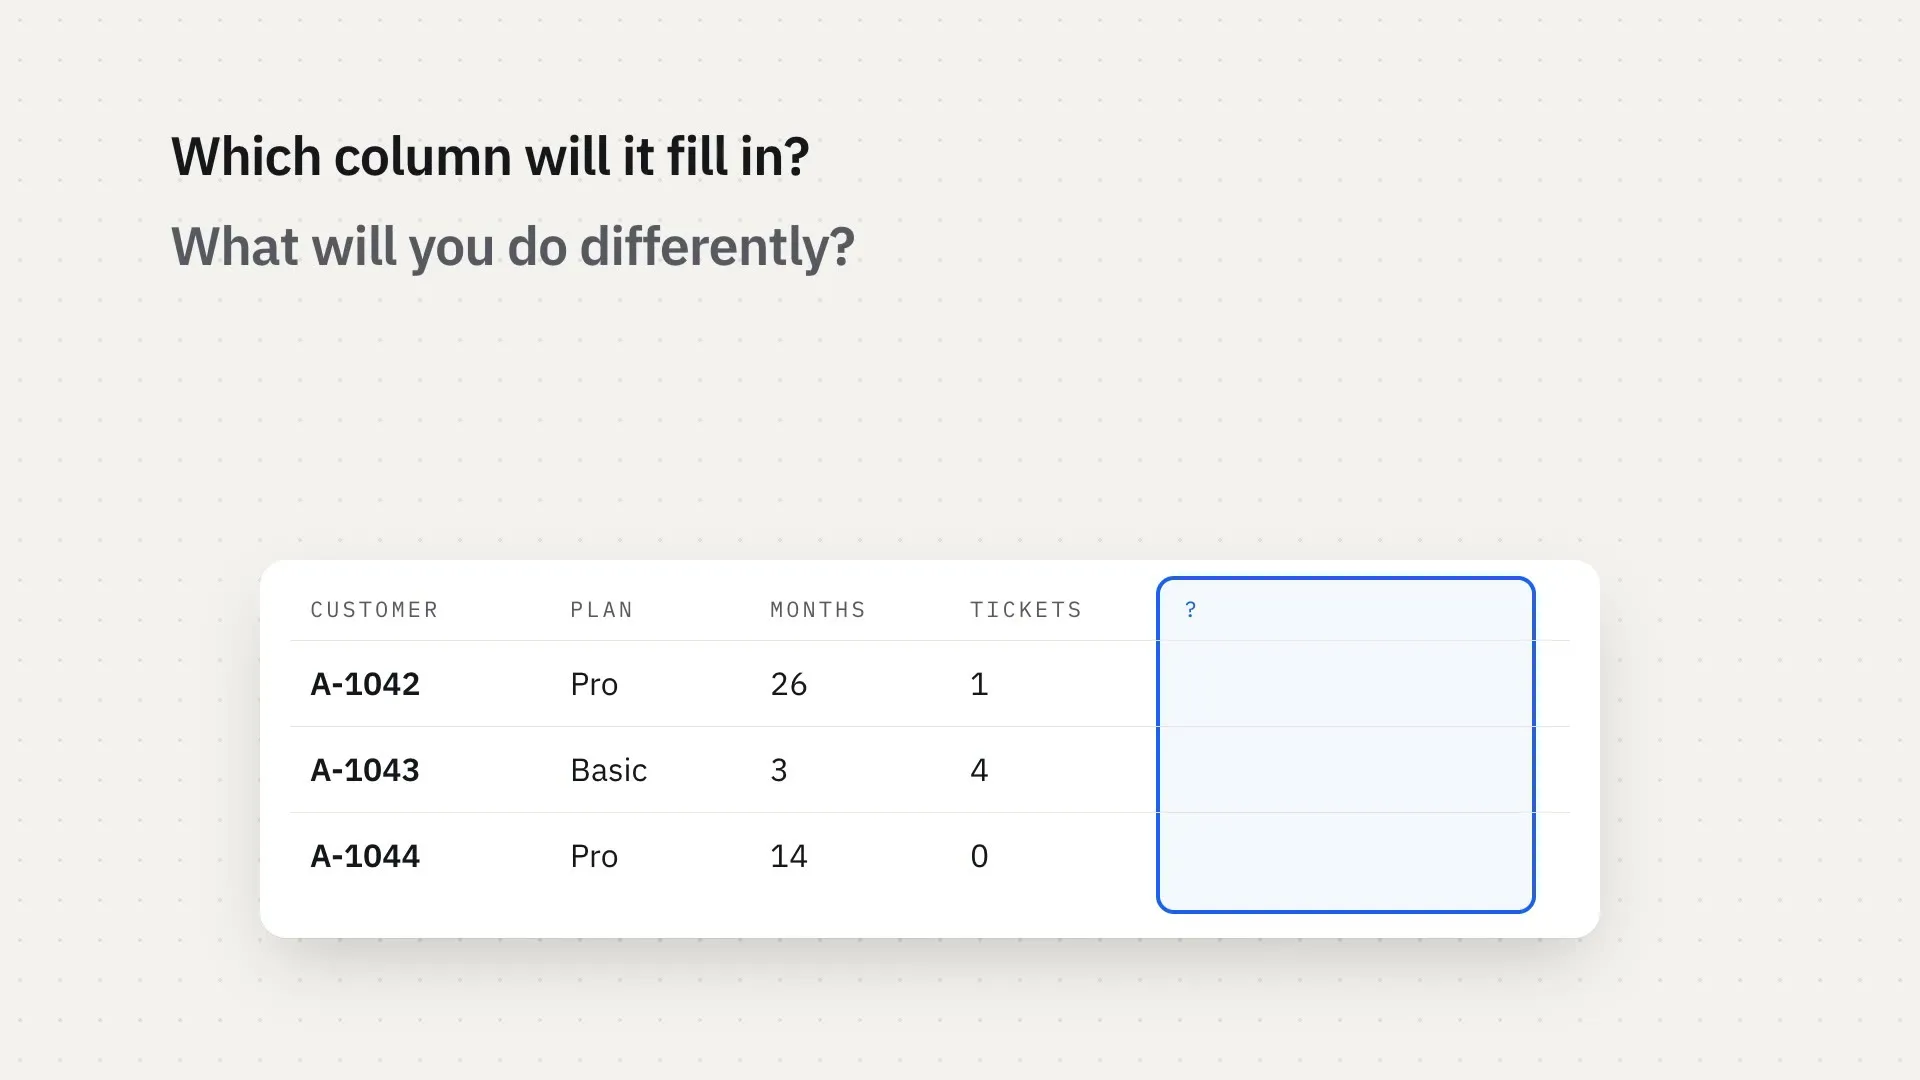
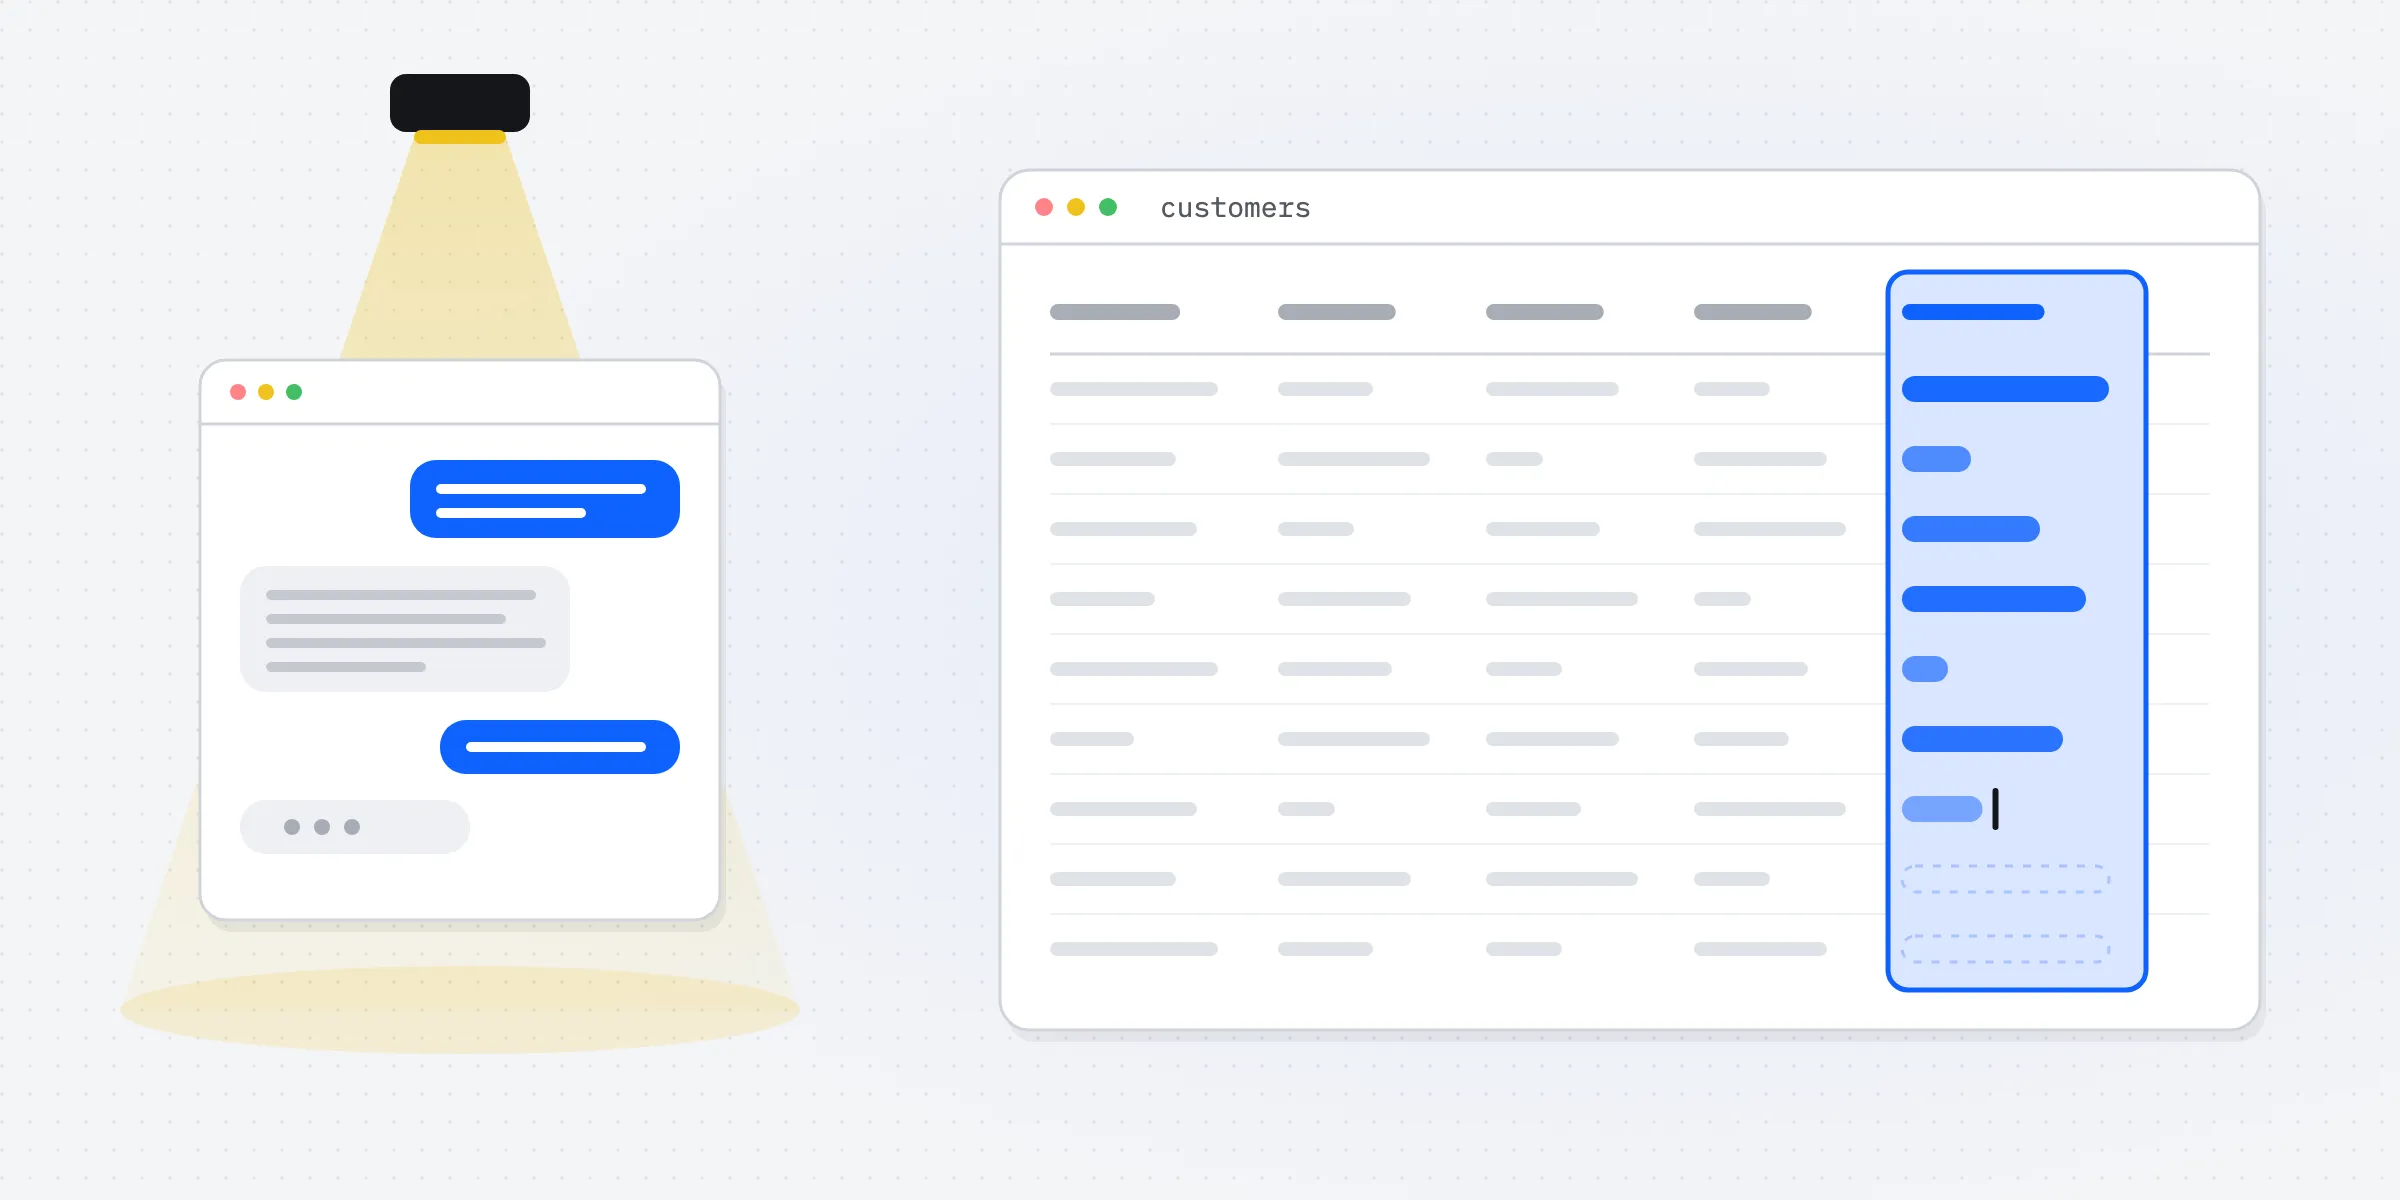
Ask people what AI is, and they describe a chatbot. Ask which AI earns a business money, and the answer is usually a table with one more column: who will leave, who will pay late, how many to order, which payment to stop. Most of the AI that runs a business learns to fill in that column from the others.
Generative AI has the attention, and it now leads the count of firms that use AI. Both facts are true. This article explains why they don't contradict each other, and what follows for where a business should start.
A task is not a use case
Two words are often confused. An AI task is a method: classify, forecast, group, rank, retrieve, generate. A use case is a business problem: churn, credit, fraud, collections, staffing. A handful of tasks serve hundreds of use cases.
The most common task is the plainest. Take a table of customers, one row for each, with what you know about them in the columns, and teach a model to fill in the column you can't see yet: will this customer leave? The same task, on other tables, scores credit applications, flags fraudulent payments, ranks overdue accounts for collections, and sorts insurance claims. Tabular data is data in rows and columns, the shape of a ledger, a customer database, or an order system.
In Orama Lake, a task is a methodology, and a use case answered end to end is a solution. Of the twenty solutions in Lake's catalogue, ten are built on the tabular method, more than on any other.1
Two counts that disagree
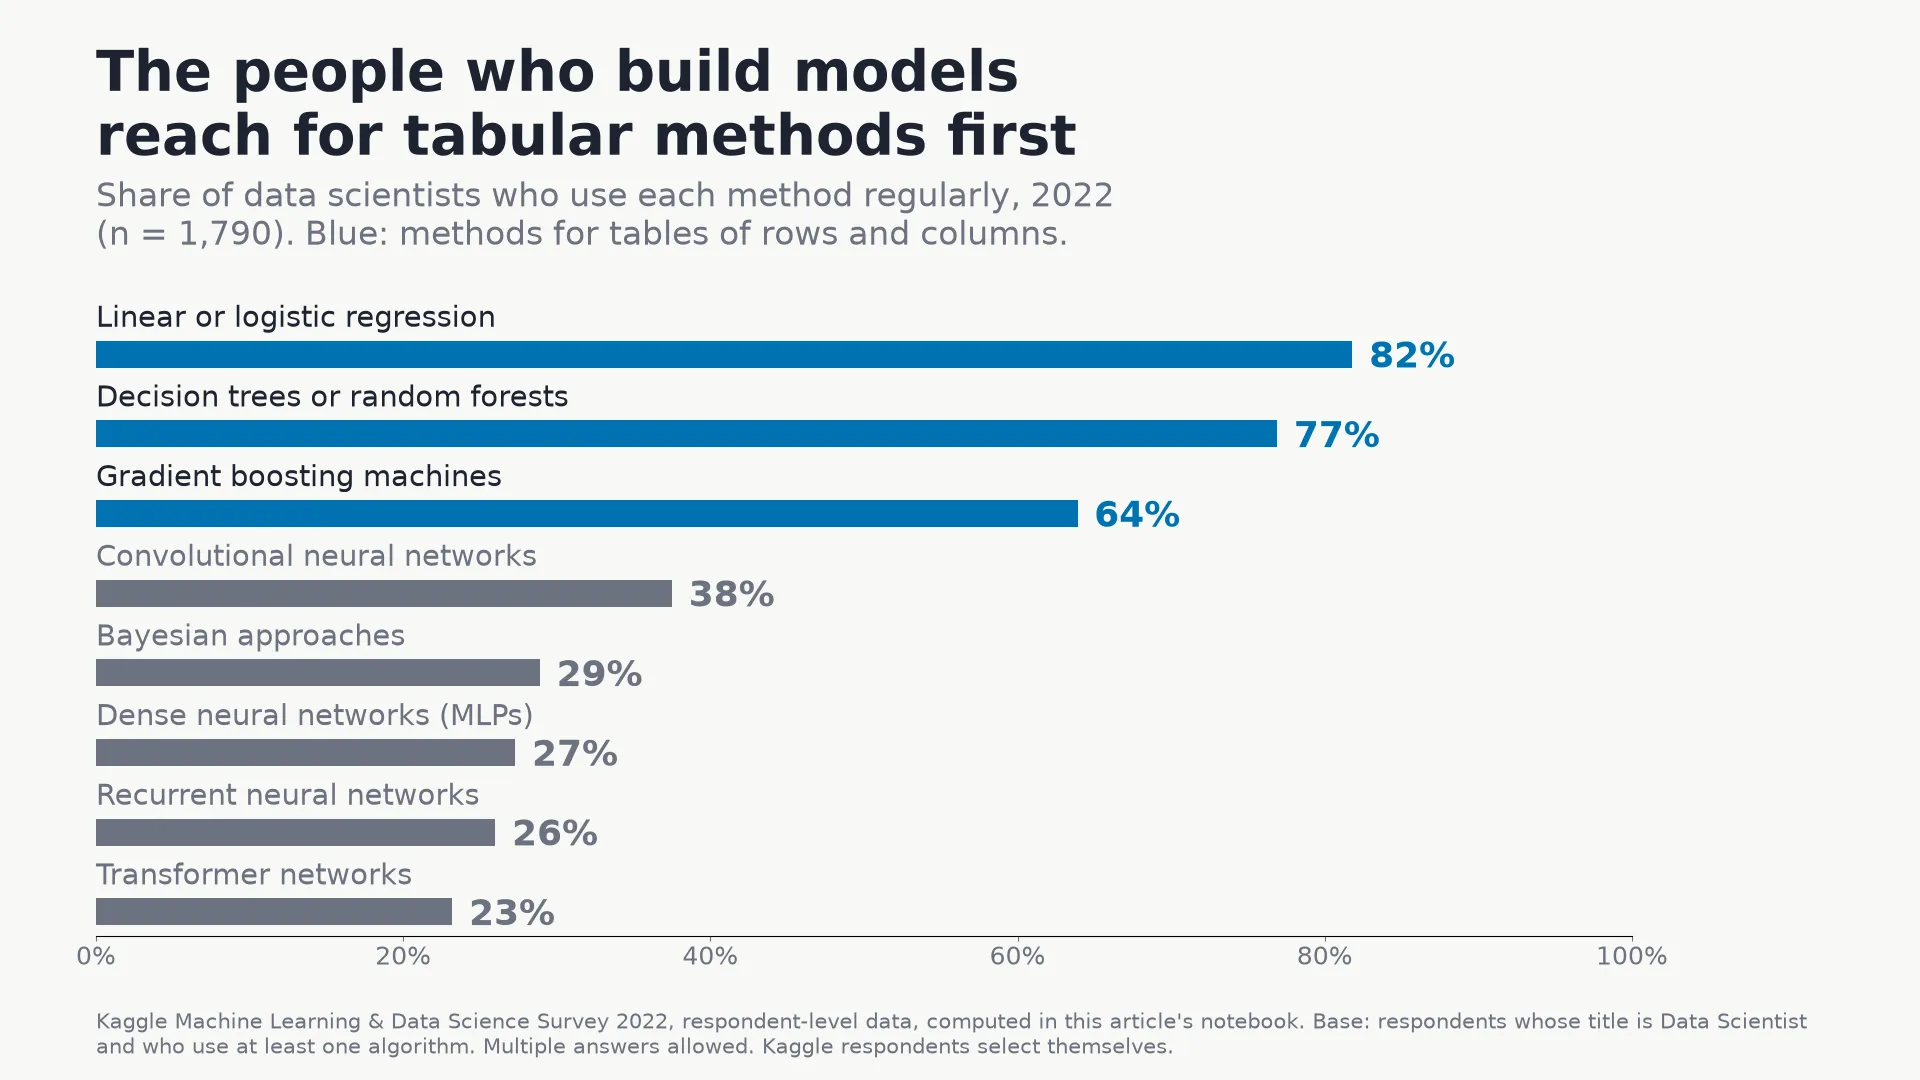
Count the people who build models, and tables win. In Kaggle's 2022 survey, 82% of data scientists said they regularly use linear or logistic regression, 77% decision trees or random forests, and 64% gradient boosting. Only 23% used transformers, the architecture behind today's language models.2 The order barely changed from 2019, though transformer use doubled, and it was the same among respondents whose employers had models in production.
The benchmarks agree. Gradient-boosted decision trees "have dominated tabular data for the past 20 years," in the words of a 2025 Nature paper that introduced a challenger to them.3 In machine learning competitions, they "remain the go-to tabular competition winner's modelling tool."4
Count firms, and language wins. In 2021, enterprises in the European Union used text mining and machine learning for data analysis at about the same rate: 2.5% and 2.4%. By 2025, 11.8% used text mining, against 5.1% using machine learning.5 In the United Kingdom, 18% of firms used large language models in June 2026, against 12% using machine learning to process data.6 The OECD sums it up: text analysis and natural language generation "are the most widely adopted."7
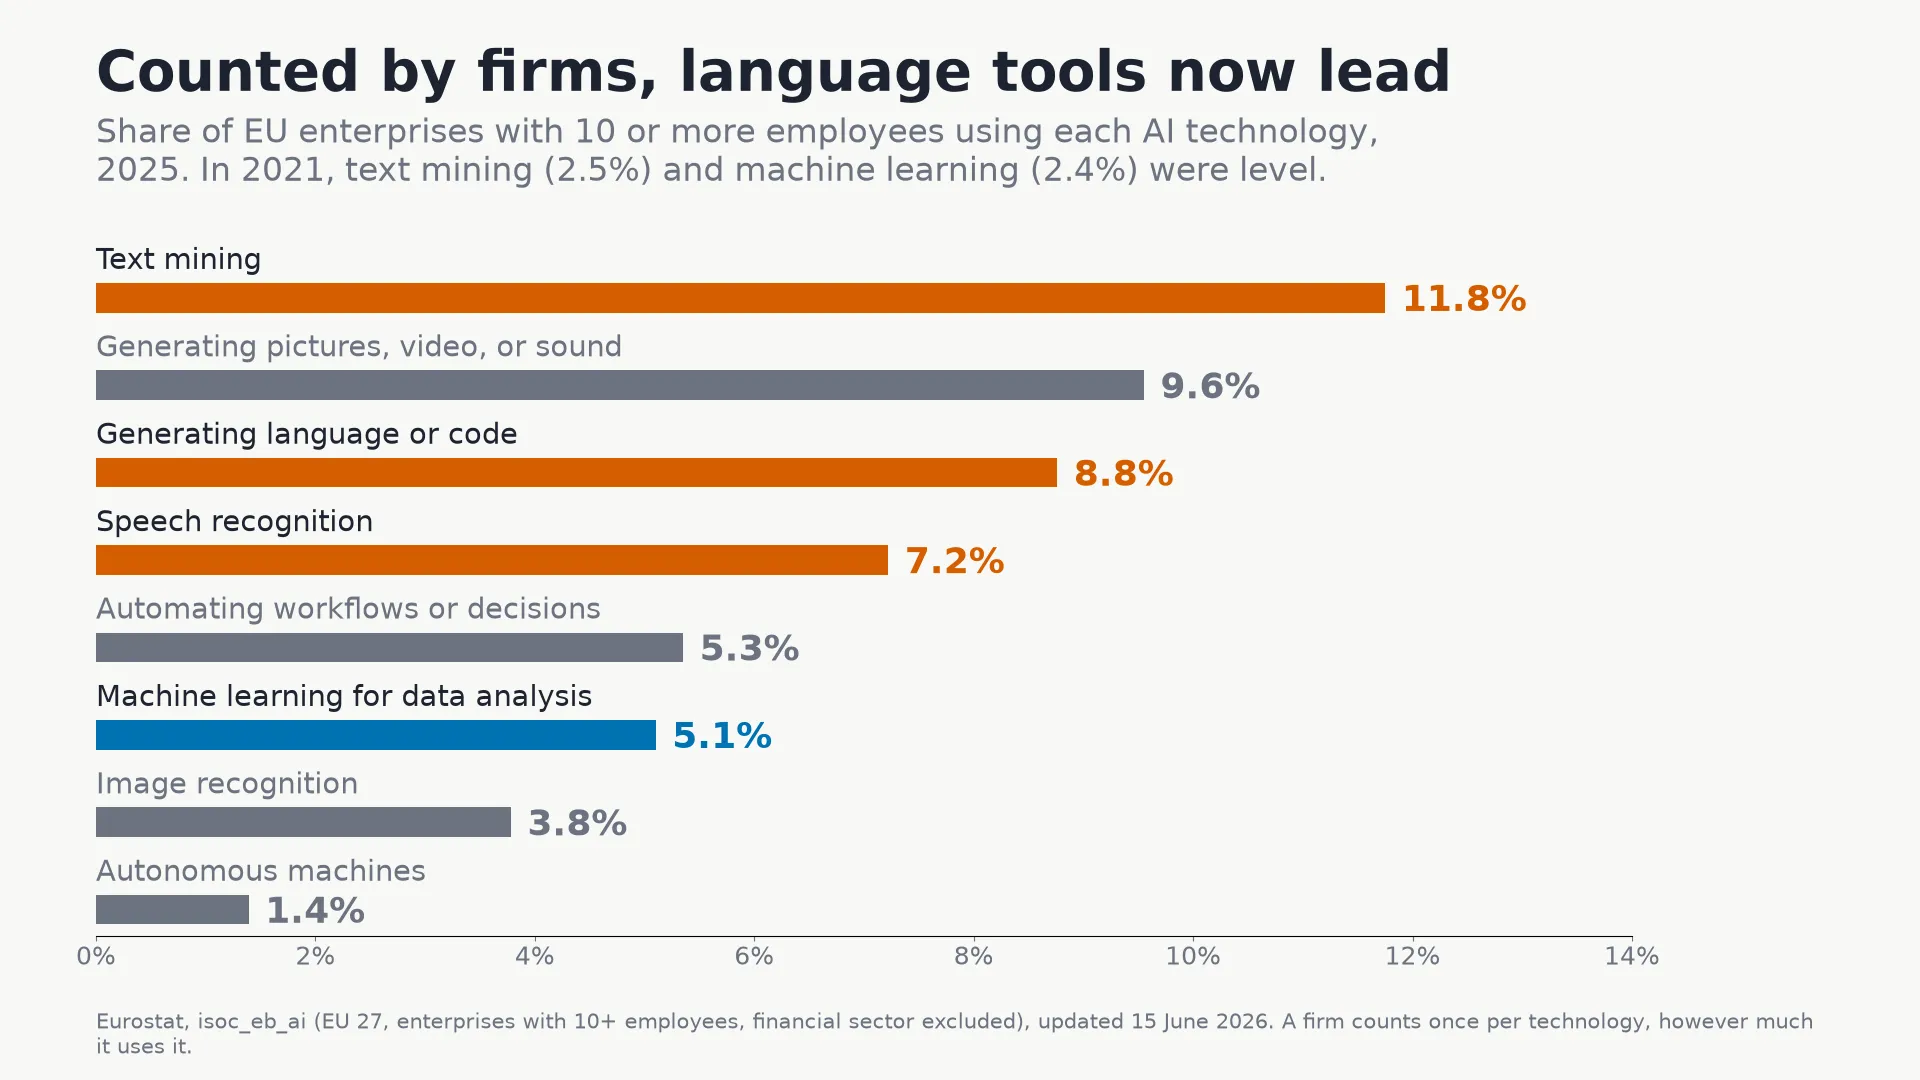
Both counts are right, because they count different things. A language tool is bought by the seat. Anyone can use it, and a survey counts the firm once, whether one person tried it or a whole department lives in it. A predictive model is built, usually for one decision, and it sits inside a system: a fraud screen, a collections queue, a forecast in the planning software. A bank that runs a hundred credit models also counts once. A survey of firms measures how far a tool has spread. In my reading, it says little about where the decisions are.
Most data is text. Most decisions are tables.
A common objection runs: most business data is unstructured, so text and images must be the bigger opportunity. The usual figure, 80%, goes back to a 1998 Merrill Lynch report that said only "Some estimates run as high as 80%."8 A better-sourced estimate, from IDC, puts unstructured data at 90% of the data organizations generated in 2022. The same paper estimates that only 40% of spending on data technology goes to projects focused on unstructured data.9
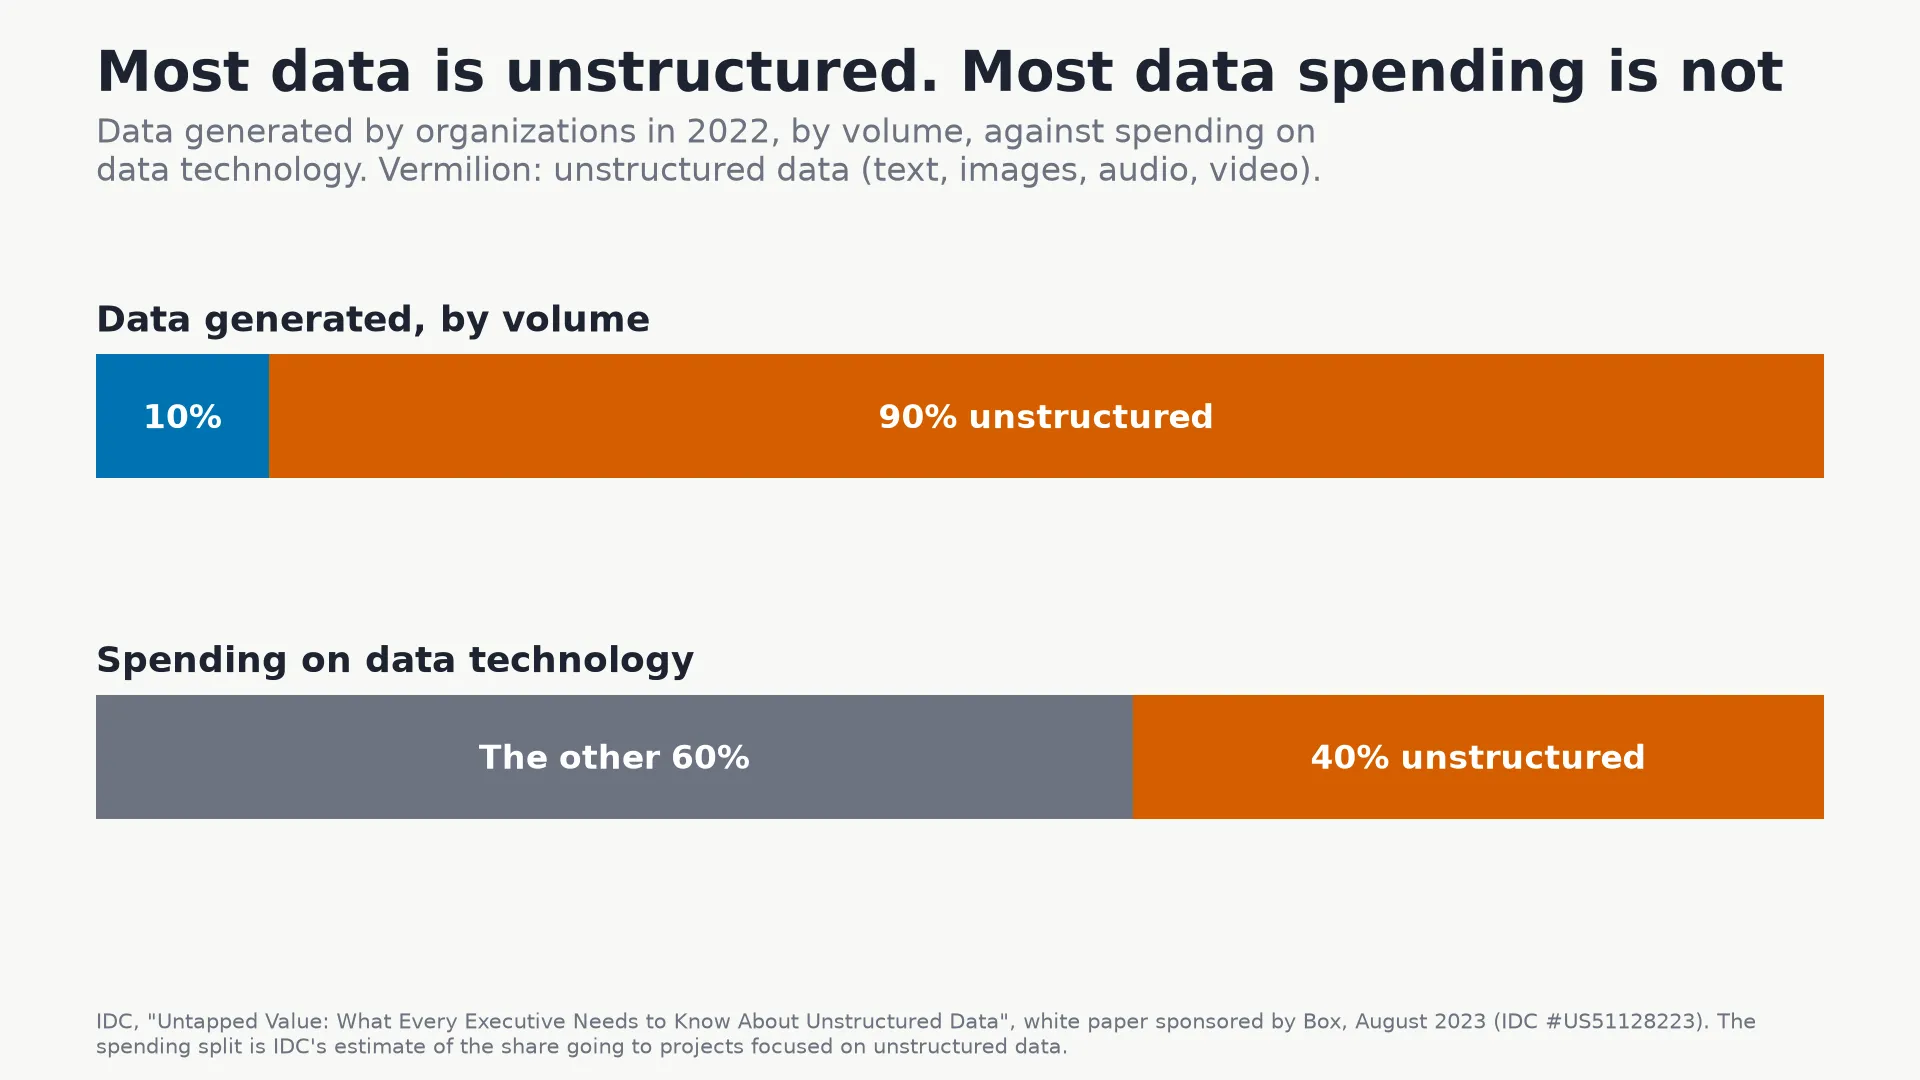
The gap makes sense. Most bytes are emails, documents, images, and recordings. Most decisions are made on rows: an invoice is paid from its record, not from the PDF it arrived as. Some of the most useful language work turns documents into rows, so a table can use them.
Where value has been measured
I found no study that ranks AI use cases by the return they delivered across many firms. What exists is a set of field experiments, on both sides.
At Zara, a clearance-pricing model tested in every Belgian and Irish store raised clearance revenue by about 6%.10 At a debt collection agency, algorithmic decisions about whom to call achieved 23.4% higher repayment than human collection officers.11 On the generative side, an AI assistant made customer-support agents 15% more productive,12 and a coding assistant raised the tasks developers completed by 26%.13
Both kinds of AI pay. The money, though, has moved faster than the measured returns. McKinsey's own estimates put generative AI's potential at "15 to 40 percent" on top of what other AI and analytics could unlock; matching low estimate to low and high to high, that is about a quarter.14 Yet generative AI took nearly half of all private investment in AI in 2025: 170.9 billion of 344.7 billion dollars.15
Churn, done right
Churn prediction is the classic tabular use case, and it carries a warning. In two field experiments, Eva Ascarza found that "customers identified as having the highest risk of churning are not necessarily the best targets for proactive churn programs."16 Some customers at high risk leave whatever you offer them; some at low risk stay only because someone called. Aurélie Lemmens and Sunil Gupta targeted customers by the profit a campaign would make from them instead, and in two field experiments that approach led to "significantly more profitable campaigns than competing models."17
So the value of the table is not the prediction. It is the decision the prediction changes, measured against a group of customers who got the old decision.
Where to start
List the decisions your business makes every day: whom to call, what to order, which claim to check, which customer to keep. Most of them come down to one row and one missing value. That is where AI has the longest record, the most practitioners, and returns measured in the field.
Use the language tools as well. They are good at turning documents and conversations into rows, and at helping the people who act on an answer. The decision itself usually lives in a table.
So here is the test for any AI plan: which column will it fill in, and what will you do differently once it is filled?
Notes
- Orama Lake's methodology registry, "Methodology portfolio" table, and its solution registry: twenty catalogue solutions, ten of which name tabular supervised learning (M-1). ↩
- Kaggle, Machine Learning and Data Science Survey 2022, respondent-level data, computed for this article. Base: 1,790 respondents whose title is Data Scientist and who use at least one algorithm; respondents select themselves. The 2019 shares and the production-employer subset come from the same computation. ↩
- Hollmann et al., "Accurate Predictions on Small Data with a Tabular Foundation Model" (2025). ↩
- Carlens, "State of Machine Learning Competitions in 2025" (2026). ↩
- Eurostat, "Artificial Intelligence by Size Class of Enterprise" (isoc_eb_ai), enterprises with 10 or more employees, financial sector excluded. ↩
- Office for National Statistics, "Artificial Intelligence in UK Businesses: 2023 to 2026" (2026), businesses with 10 or more employees. ↩
- OECD, Digital Economy and Society Outlook 2026, "Digital Technology Diffusion and the Economy." ↩
- Grimes, "Unstructured Data and the 80 Percent Rule" (2008), quoting Shilakes and Tylman of Merrill Lynch (1998). ↩
- Muscolino et al., Untapped Value: What Every Executive Needs to Know About Unstructured Data (IDC, 2023), a white paper sponsored by Box. The spending share is IDC's estimate. ↩
- Caro and Gallien, "Clearance Pricing Optimization for a Fast-Fashion Retailer" (2012), abstract. ↩
- Zhou, "Artificial Intelligence and Debt Collection: Evidence from a Field Experiment" (2024), abstract. ↩
- Brynjolfsson, Li, and Raymond, "Generative AI at Work" (2025), abstract: issues resolved per hour, 5,172 agents. ↩
- Cui et al., "The Effects of Generative AI on High-Skilled Work" (2025): 26.08% more completed tasks across three experiments and 4,867 developers. ↩
- Chui et al., The Economic Potential of Generative AI (McKinsey, 2023): 2.6 to 4.4 trillion dollars a year against 11 to 17.7 trillion for non-generative AI and analytics. "About a quarter" is my arithmetic from those ranges. ↩
- Stanford HAI, The 2026 AI Index Report, chapter 4, "Economy." ↩
- Ascarza, "Retention Futility" (2018), abstract. ↩
- Lemmens and Gupta, "Managing Churn to Maximize Profits" (2020), abstract. ↩
Bibliography
- Ascarza, Eva. 2018. "Retention Futility: Targeting High-Risk Customers Might Be Ineffective." Journal of Marketing Research 55 (1): 80–98. https://doi.org/10.1509/jmr.16.0163.
- Brynjolfsson, Erik, Danielle Li, and Lindsey Raymond. 2025. "Generative AI at Work." Quarterly Journal of Economics 140 (2): 889–942. https://doi.org/10.1093/qje/qjae044.
- Carlens, Harald. 2026. "State of Machine Learning Competitions in 2025." ML Contests. https://mlcontests.com/state-of-machine-learning-competitions-2025/. Accessed 2026-11-19.
- Caro, Felipe, and Jérémie Gallien. 2012. "Clearance Pricing Optimization for a Fast-Fashion Retailer." Operations Research 60 (6): 1404–1422. https://doi.org/10.1287/opre.1120.1102.
- Chui, Michael, Roger Roberts, Lareina Yee, Eric Hazan, Alex Singla, et al. 2023. The Economic Potential of Generative AI: The Next Productivity Frontier. McKinsey & Company, June 14, 2023. https://www.mckinsey.com/capabilities/mckinsey-digital/our-insights/the-economic-potential-of-generative-ai-the-next-productivity-frontier. Accessed 2026-11-19.
- Cui, Zheyuan Kevin, Mert Demirer, Sonia Jaffe, Leon Musolff, Sida Peng, and Tobias Salz. 2025. "The Effects of Generative AI on High-Skilled Work: Evidence from Three Field Experiments with Software Developers." Working paper, February 2025. https://economics.mit.edu/sites/default/files/inline-files/draft_copilot_experiments.pdf. Accessed 2026-11-19.
- Eurostat. 2026. "Artificial Intelligence by Size Class of Enterprise (isoc_eb_ai)." Updated June 15, 2026. https://ec.europa.eu/eurostat/api/dissemination/statistics/1.0/data/isoc_eb_ai. Accessed 2026-11-19.
- Grimes, Seth. 2008. "Unstructured Data and the 80 Percent Rule." Breakthrough Analysis, August 1, 2008. https://breakthroughanalysis.wordpress.com/2008/08/01/unstructured-data-and-the-80-percent-rule/. Accessed 2026-11-19.
- Hollmann, Noah, Samuel Müller, Lennart Purucker, et al. 2025. "Accurate Predictions on Small Data with a Tabular Foundation Model." Nature 637 (8045): 319–326. https://doi.org/10.1038/s41586-024-08328-6.
- Kaggle. 2022. "Kaggle Machine Learning & Data Science Survey 2022." Respondent-level data. https://www.kaggle.com/kaggle-survey-2022. Shares computed for this article by the notebook kaggle_shares.py.
- Lemmens, Aurélie, and Sunil Gupta. 2020. "Managing Churn to Maximize Profits." Marketing Science 39 (5): 956–973. https://doi.org/10.1287/mksc.2020.1229.
- Muscolino, Holly, John Rydning, Amy Machado, and Dan Vesset. 2023. Untapped Value: What Every Executive Needs to Know About Unstructured Data. IDC White Paper US51128223, sponsored by Box, August 2023. https://resources.wisdominterface.com/wp-content/uploads/2024/02/IDC-Unstructured-Data-White-Paper.pdf. Accessed 2026-11-19.
- OECD. 2026. OECD Digital Economy and Society Outlook 2026, "Digital Technology Diffusion and the Economy." https://www.oecd.org/en/publications/oecd-digital-economy-and-society-outlook-2026_022ed474-en/full-report/digital-technology-diffusion-and-the-economy_b355e780.html. Accessed 2026-11-19.
- Office for National Statistics. 2026. "Artificial Intelligence in UK Businesses: 2023 to 2026." July 20, 2026. https://www.ons.gov.uk/businessindustryandtrade/business/businessservices/articles/artificialintelligenceinukbusinesses/2023to2026. Accessed 2026-11-19.
- OramaSearch, Inc. 2026. "Machine Learning: Methodology Portfolio" and "Solution Registry." Orama Lake (zetta) documentation, docs/ml/README.md and docs/solutions/README.md.
- Stanford Institute for Human-Centered Artificial Intelligence (HAI). 2026. The 2026 AI Index Report. Chapter 4, "Economy." https://hai.stanford.edu/assets/files/ai_index_report_2026_chapter_4_economy.pdf. Accessed 2026-11-19.
- Zhou, Yijun. 2024. "Artificial Intelligence and Debt Collection: Evidence from a Field Experiment." SSRN Working Paper 4905228, July 25, 2024. https://papers.ssrn.com/sol3/papers.cfm?abstract_id=4905228. Accessed 2026-11-19.